Life's Been Good...for Large Caps

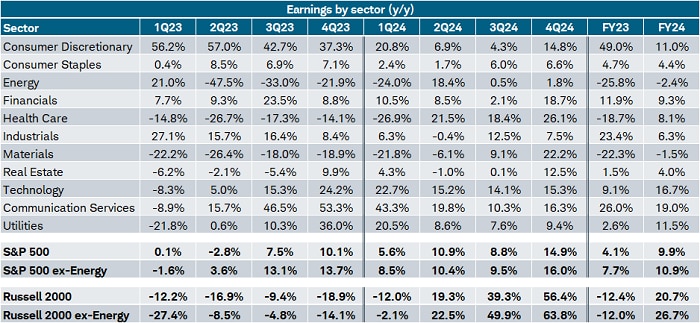
With nearly 50% of S&P 500 companies having reported profits for the first quarter, earnings season is in full swing. So far, so good, given the blended growth rate—which combines already-reported results and estimates for companies which have not yet reported—is 5.6% year-over-year. It's worth noting that the blended rate would be 8.7% if adjusting for a major drag from the Health Care sector. Per LSEG (London Stock Exchange Group) I/B/E/S, the one-time $12 billion charge related to Bristol Myers Squibb's acquisition of Karuna Therapeutics, accounts for the discrepancy.
Less rosy is the blended growth rate for the Russell 2000, at -12% for the first quarter. Fortunately for that index, base effects will likely start to turn increasingly favorable. Small caps (as of Friday) are expected to see a better year of earnings growth with a current estimate of 20.7% for 2024 (vs. 9.9% for the S&P 500), as shown in the table below.
Source: Charles Schwab, LSEG I/B/E/S, as of 4/26/2024.
Forecasts contained herein are for illustrative purposes only, may be based upon proprietary research and are developed through analysis of historical public data. Indexes are unmanaged, do not incur management fees, costs and expenses and cannot be invested in directly. Past performance does not guarantee future results.
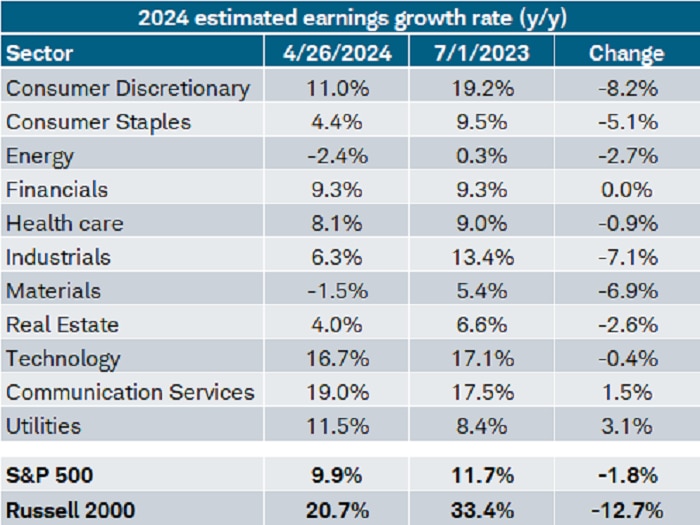
While a stronger relative growth rate for small caps is a positive, it has to be looked at in a broader context. The estimate for 2024 earnings growth has been cut aggressively since last summer—from 33.4% in July 2023 to 20.7% as of Friday. For the S&P 500, cuts to estimates have been less dramatic, from 11.7% to 9.9% over the same timeframe. It's normal to see analysts revise their estimates lower throughout the year. However, that tends to end around the middle of the year, so if estimates are still getting slashed in the back half of 2024, it will be more of a warning sign.
Source: Charles Schwab, LSEG I/B/E/S, as of 4/26/2024.
S&P 500 sectors shown. Forecasts contained herein are for illustrative purposes only, may be based upon proprietary research and are developed through analysis of historical public data. Indexes are unmanaged, do not incur management fees, costs and expenses and cannot be invested in directly. Past performance does not guarantee future results.
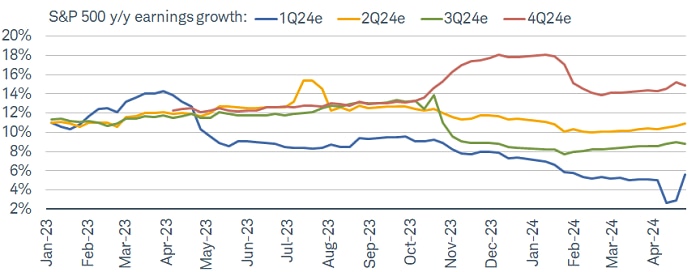
The real-time cuts to estimates are shown in the chart below. Focusing first on the blue line, which is the estimate for first-quarter earnings growth, analysts were expecting growth of around 14% this time last year. As that expectation has been revised lower significantly, estimates for the rest of the year have mostly trended higher over the past few months. Notably, the consensus estimate for the fourth quarter of this year remains strong at nearly 15%, although it has ticked down.
Earnings optimism for 2024
Source: Charles Schwab, LSEG I/B/E/S, as of 4/26/2024.
S&P 500 sectors shown. Forecasts contained herein are for illustrative purposes only, may be based upon proprietary research and are developed through analysis of historical public data. Indexes are unmanaged, do not incur management fees, costs and expenses and cannot be invested in directly. Past performance does not guarantee future results.
Focusing on what matters
Given that earnings estimates are a perpetually moving target, let's shift focus to what will likely matter more for the market moving forward. Across several metrics, valuations remain stretched. Per Bloomberg data, the S&P 500's forward price-to-earnings (P/E) ratio is 20.3 and its price-to-sales (P/S) ratio is up to 2.7. Both are elevated relative to their long-term averages (going back to 2000) of 16.5 and 1.7, respectively.
Any rally driven more by multiple expansion (growth in the P/E, P/S, or any valuation metric) underscores investors' optimism and, at times, exuberance. Given valuation is a horrible short-term market-timing tool, though, we don't think the current expensive nature of the market means the bull run is at an imminent end. Rather, we think continued strength in earnings growth will help put downward pressure on valuations—but key is whether both the top and bottom lines can hold up.
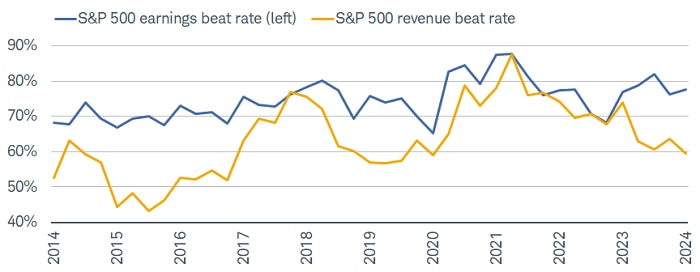
As shown in the chart below, that is the case so far for first quarter earnings, but not as much for revenues. The "beat rate" (the percentage of companies reporting growth above analysts' estimates) for earnings has ticked up to a healthy 77.7%, which is stronger than the average of 67% (going back to 1994) but slightly worse than the prior four-quarter average of 79%. It's a different (and worse) story for the revenue beat rate, which has fallen to 59.4%. Not only does that compare to a longer-term average (back to 2002) of 62%, but it's the lowest since the first quarter of 2020.
Surprise party (for earnings only)
Source: Charles Schwab, LSEG I/B/E/S, as of 4/26/2024.
S&P 500 sectors shown. Indexes are unmanaged, do not incur management fees, costs and expenses and cannot be invested in directly. Past performance does not guarantee future results.
Keep in mind that beat rates don't necessarily correlate with actual growth results. As the revenue beat rate has slid over the past year, revenue growth has continued to improve. However, given the growing gap between earnings and revenue surprises—and the fact that stronger earnings growth has been driven by aggressive cost cutting—we think there will be more focus on the revenue side moving forward.
That could be the reason the market is less excited about companies that outpace analysts' earnings estimates. As shown in the chart below, after reporting earnings, the average S&P 500 member's daily return in excess of the index's return is barely positive at 0.05% so far in this reporting season. That is the weakest return since the fourth quarter of 2020, which, perhaps not coincidently, was the last time the revenue beat rate was as low as it is now.
Market less forgiving
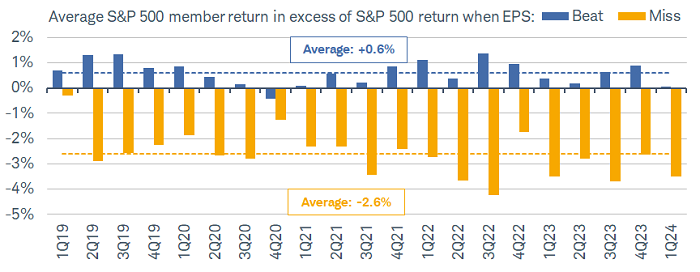
Source: Charles Schwab, Bloomberg, as of 04/26/2024.
Member performance in excess of S&P 500 based on gain or loss following day in which earnings are reported. Average covers period from 1Q2019 to 1Q2024. Indexes are unmanaged, do not incur management fees, costs and expenses and cannot be invested in directly. Past performance does not guarantee future results.
Large and in charge
One of the frustrating aspects of the bull market that started in October 2022 is the lack of strength from small caps. Not only is the S&P 500 outperforming the Russell 2000 by 8% this year, its 42.3% gain since the October 2022 low is much stronger than the Russell 2000's 18.6% gain over the same period, and it's outperforming the Russell 2000 by nearly 10% over the past year (as shown in the chart below).
Small caps, smaller returns
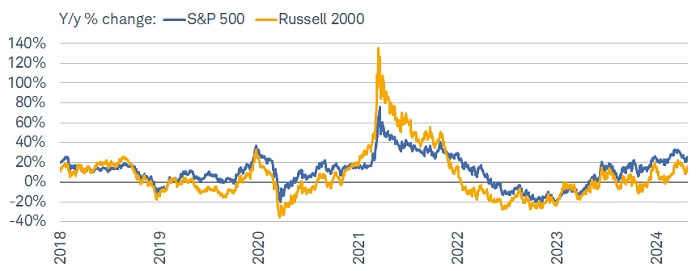
Source: Charles Schwab, Bloomberg, as of 4/26/2024.
Indexes are unmanaged, do not incur management fees, costs and expenses and cannot be invested in directly. Past performance does not guarantee future results.
While it is highly unusual for small caps to lag so much in the early years of a bull market, we think the performance gap can be explained by the trajectory of forward-earnings estimates. As shown in the chart below, forward 12-month estimated earnings for the S&P 500 are well beyond their 2022 high. Conversely, while estimated earnings for the Russell 2000 have moved up over the past year, the growth rate remains far from its 2022 peak. There had been a strong recovery starting in the summer of 2023, but it has since reversed.
Large-cap earnings dominate
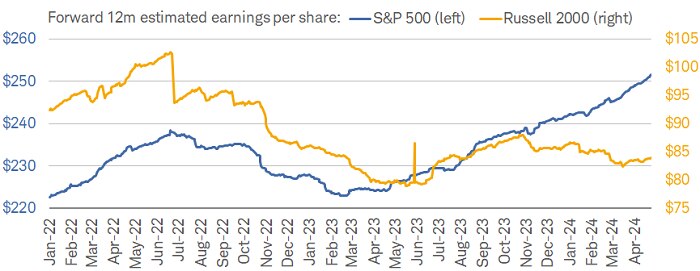
Source: Charles Schwab, Bloomberg, as of 4/26/2024.
Indexes are unmanaged, do not incur management fees, costs and expenses and cannot be invested in directly. Past performance does not guarantee future results.
We continue to think high-quality small caps can do well throughout the year, but for the overall index to recover meaningfully, interest rate volatility needs to subside and forward earnings growth must reaccelerate.
In sum
Despite a tougher performance backdrop in April, the market still looks quite expensive across a wide variety of metrics. Multiple expansion in and of itself is not a negative for near-term performance, but its key role in driving stocks higher over the past year means the bar is higher for earnings growth. Fortunately, estimates point to a solid year for profits, but we think the market will continue to put an increasing amount of emphasis on revenue growth and forward guidance. We continue to suggest that investors focus on areas that will weather the higher-for-longer rate environment well—namely, companies (or industries) with high interest coverage, strong revenue growth, and strong cash positions (among other high-quality metrics).