Schwab Market Perspective: Rolling Recovery?

Listen to the latest audio Schwab Market Perspective.
As U.S. economic growth continues to surprise to the upside, investors have repeatedly reconsidered expectations about when and how quickly the Federal Reserve will begin to cut interest rates. This has led to some volatility in the Treasury market, which may continue until there is greater clarity about inflation and the timing of potential Fed policy changes. Meanwhile, we explain why oil prices are unlikely to sustainably appreciate further despite current geopolitical risks.
U.S. stocks and economy: Rolling recoveries unfolding?
There are early signs that some previous "rolling recessions" across various sectors or geographies in the United States are starting to turn into rolling recoveries. One of the sectors that first entered its own slowdown (in late 2022 and into early 2023) was the manufacturing sector. As reflected in the Purchasing Managers' Index (PMI) from the Institute for Supply Management (ISM), you can see in the chart below that the manufacturing sector fell into contraction (a level below 50) in November 2022. It remained in that state until this past March, and now, the PMI is at its highest since September 2022.
As the manufacturing PMI has carved out a bottom and now started to turn higher, the services PMI has continued to soften. The good news is that the index is still in expansion territory; the bad news is that the path of least resistance still may be lower. We continue to think the best-case scenario for the broader economy is for the continued roll-through of slower activity. The key for the rest of this year is whether the coming strength in manufacturing can offset any coming weakness in services—essentially, the inverse of what we've seen over the past year.
Manufacturing and services offsets
Source: Charles Schwab, Bloomberg, as of 5/10/2024.
The other key to the economy's health will be whether the labor market can stay resilient on the surface despite some subtle cracks that have been widening. As shown in the chart below, the pace of growth in part-time employment relative to full-time employment has been accelerating rather sharply. In and of itself, this isn't a negative development for the economy. However, you can see that the uptrend is typically consistent with recessions. Additionally, it isn't supportive that over the past few months, full-time employment has been contracting.
Part-timers hired faster
Source: Charles Schwab, Bloomberg, as of 4/27/2024.
Bifurcations are not only existent in the economy. Despite a broader and healthier market this year, much of the improvement in participation has been concentrated up the market-capitalization spectrum in indexes like the S&P 500. Strength hasn't been as broad-based for the small-cap universe, for example. As shown in the chart below, you can see that nearly 80% of members in the S&P 500 are trading above their 200-day moving averages. For the Russell 2000, the share is just below 60%; for the Nasdaq, it's even weaker at less than 50%.
Breadth better for large caps
Source: Charles Schwab, Bloomberg, as of 5/10/2024.
Forecasts contained herein are for illustrative purposes only, may be based upon proprietary research and are developed through analysis of historical public data. Indexes are unmanaged, do not incur management fees, costs and expenses and cannot be invested in directly. Past performance does not guarantee future results.
This isn't to say parts of the small-cap world are not doing well, but those that have improved are much higher-quality in nature—fitting with our guidance that investors should continue to screen for segments of the market that score well across an array of profitability metrics.
Fixed income: Inflation in focus
The 10-year Treasury bond yield is near the highs of the year, responding to stronger-than-expected U.S. economic growth, rising inflation fears, and diminishing expectations for Federal Reserve rate cuts. Investors are concerned that the "soft landing" in economic growth and inflation that has prevailed over the past year may be in danger of turning into an inflationary growth spell. These concerns could mean a slower pace of Fed rate cuts and a higher ending point in this cycle. Nonetheless, there is still room for bond yields to fall in 2024 and 2025.
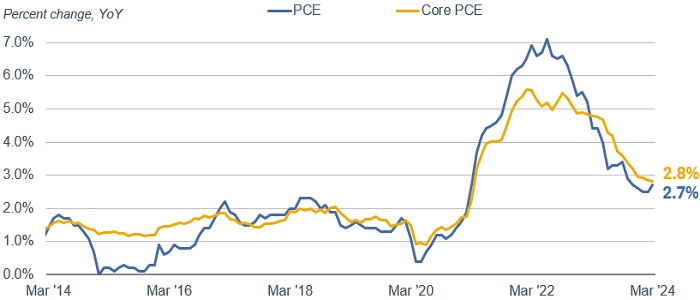
In the long run, the most important factor for the bond market is inflation. Recent inflation data indicate that the declining trend may be stalling. The measure that the Federal Reserve uses as its preferred benchmark—the deflator for personal consumption expenditures excluding food and energy (or "core" PCE)—is still falling compared to the year-ago growth rate, but the pace of decline has slowed.
PCE and core PCE year-over-year growth has slowed
Source: Bloomberg and the Federal Reserve.
Market estimate of the Fed funds using Fed Funds Futures Implied Rate (FFX3 COMB Comdty). Market estimates as of 12/29/2023 and 5/13/2024, respectively, with "Median DOT Plot" from the 3/20/2024 FOMC meeting. respectively. For illustrative purposes only. Futures and futures options trading involves substantial risk and is not suitable for all investors. Please read the Risk Disclosure Statement for Futures and Options prior to trading futures products.
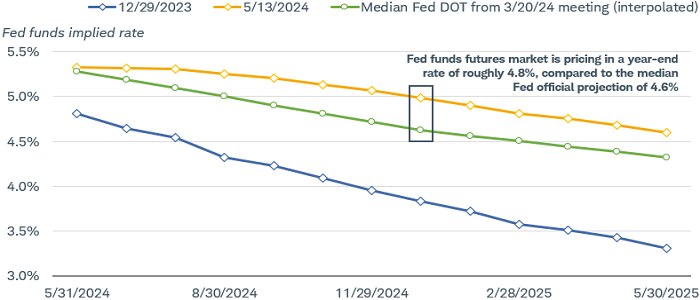
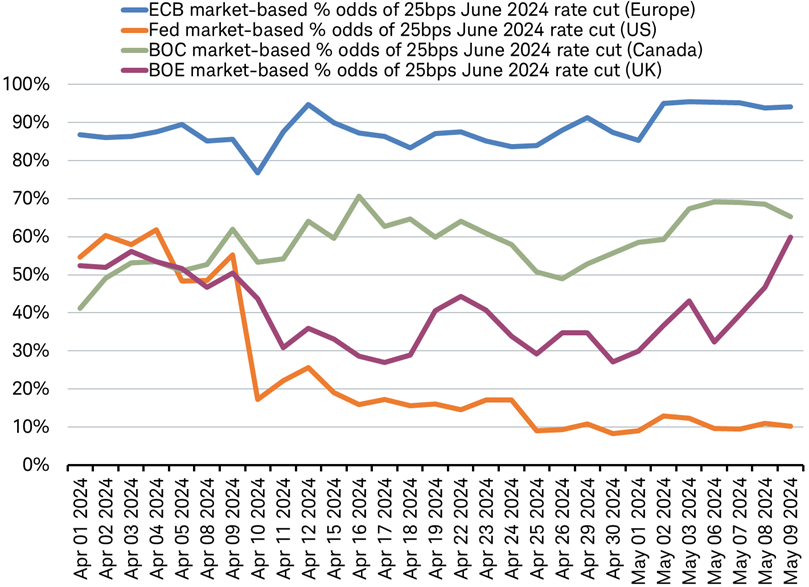
With commodity prices turning higher, led by oil and gold, amid war in the Middle East and Ukraine and job growth strong, inflation fears are running high. Various Fed officials have indicated concern that inflation may not be sufficiently under control to warrant easing monetary policy. The federal funds futures market is currently discounting just two or three rate cuts of 25 basis points each this year, compared to earlier estimates of five to six rate cuts.
Federal funds futures have shifted since the start of the year
Source: Bloomberg.
PCE: Personal Consumption Expenditures Price Index (PCE DEFY Index), Core PCE: Personal Consumption Expenditures: All Items Less Food & Energy (PCE CYOY Index), percent change, year over year. Monthly data as of 3/31/2024.
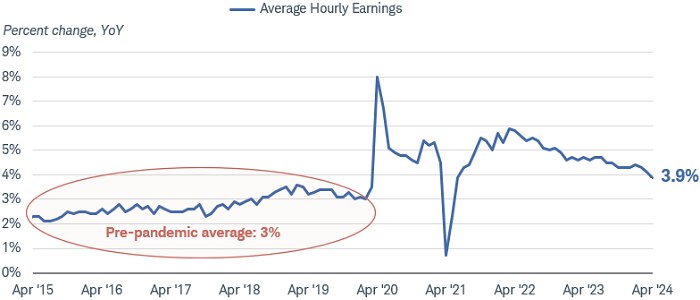
We continue to anticipate two to three rate cuts by the Fed in the second half of the year. Despite current concerns, many inflation indicators are encouraging, leaving room for a moderate easing in policy. In the labor market, wage gains have declined and leveled off despite strong job growth, suggesting that the supply of labor is keeping up with demand. The "quits" rate—the measure of how many people leave their jobs voluntarily—has fallen over the past year as the labor market has cooled off. It has been one of the more reliable leading indicators of inflation in this cycle.
Quits rate versus core PCE
Source: Bloomberg.
US Average Hourly Earnings All Employees Total Private Yearly Percent Change SA (AHE YOY% Index). Data as of 4/30/2024. Note: Pre-pandemic date range is March 2015 to March 2020.
In addition, the ISM services sector prices-paid index has fallen steeply over the past year, as well, and is now below its pre-pandemic level. Since much of the concern about "sticky" inflation has been centered on the services sector, the decline is significant.
ISM services price paid index and core PCE
Source: Charles Schwab, Bloomberg data as of 5/9/2024.
Futures, and Futures options trading involves substantial risk and is not suitable for all investors. Please read the Risk Disclosure Statement for Futures and Options prior to trading futures products. Past performance is no guarantee of future results.
Finally, the Fed's current policy rate at 5.5% is high relative to inflation at 2.8% and inflation expectations are holding in the 2% to 2.5% region based on surveys and readings from the Treasury Inflation-Protected Securities (TIPS) market. Until there is some resolution of the inflation outlook, real yields could remain elevated. However, even if the final resting place for the federal funds rate is higher than in the past due to more robust real growth than in the past, there is still room for lower rates in this cycle.
Global stocks and economy: Geopolitics and oil
The impact of geopolitical events on the markets is often felt initially through sudden and sizable moves in oil prices, especially when the events involve major oil exporters such as countries in the Middle East and Russia. A major and sustained upward move in oil prices could negatively impact inflation and central bank actions, holding the potential to spill over to stock and bond markets.
Crude oil prices posted solid gains for the first quarter of this year and the S&P 500 Energy sector index was the second-best performer in the stock market year to date,1 responding to improving global economic growth and rising geopolitical tensions, including:
- War returning to the Middle East, evoking memories of the 1973 oil embargo imposed by Arab countries in retaliation for support of Israel during the Yom Kippur War, which resulted in a quadrupling of oil prices in just three months.
- Houthi militants attacking oil tankers in the Red Sea, a route traversed by around 12% of seaborne oil.
- Ukraine targeting Russian refineries. Ukraine's campaign is moving toward taking the war inside Russia's borders, focusing on attacks on energy and transport infrastructure.
- Iran blaming Israel for the precision airstrike that killed Iranian military leaders in Syria and pledging vengeance.
Yet historically, the geopolitical impact on oil prices tends to be short-lived. For example, immediately after the 9/11 attacks, crude oil prices jumped by about 5%. However, within 14 days, the price subsequently dropped by around 25% on concerns about recession. To further illustrate, when Russia invaded Ukraine on February 24, 2022, oil prices increased roughly 30% over the following two weeks, and then slid back to their pre-invasion level two weeks later over concerns about weak economic growth and softening European oil demand. Even more recently, oil prices increased by about 4% before retreating after the Hamas attacks in Israel on October 7, 2023. Despite all the geopolitical tension over the past 10 years, oil hasn't sustained a move above $90, excepting the few months following Russia's invasion of Ukraine in 2022 which drove a reallocation of global supplies due to sanctions.
Worsening geopolitical tensions could potentially drive further gains. However, prices are near the high end of the range of the past 12 months and there are a few factors which could limit the sustainability of any additional surge.
Oil prices near high end of range
Source: Charles Schwab, Bloomberg data as of 5/9/2024.
- First, global oil production is now less concentrated in the Middle East than it has been since the 1970s. Production from Saudi Arabia and Russia has slowed since the mid-2000s, while U.S. production has more than doubled thanks to the shale boom of the 2010s, which turned the U.S. into a net energy exporter for the first time since at least 1949. In that same decade, Canada began to extract crude from the oil sands in Alberta, boosting its production. Despite sanctions from the EU and the U.S. following the invasion in Ukraine, oil from Russia, the world's third-largest producer, has continued to flow, now largely to Indian and Chinese refineries.
Oil production has increased in North America and away from geopolitical hot spots
Source: Charles Schwab, FactSet data as of 5/9/2024.
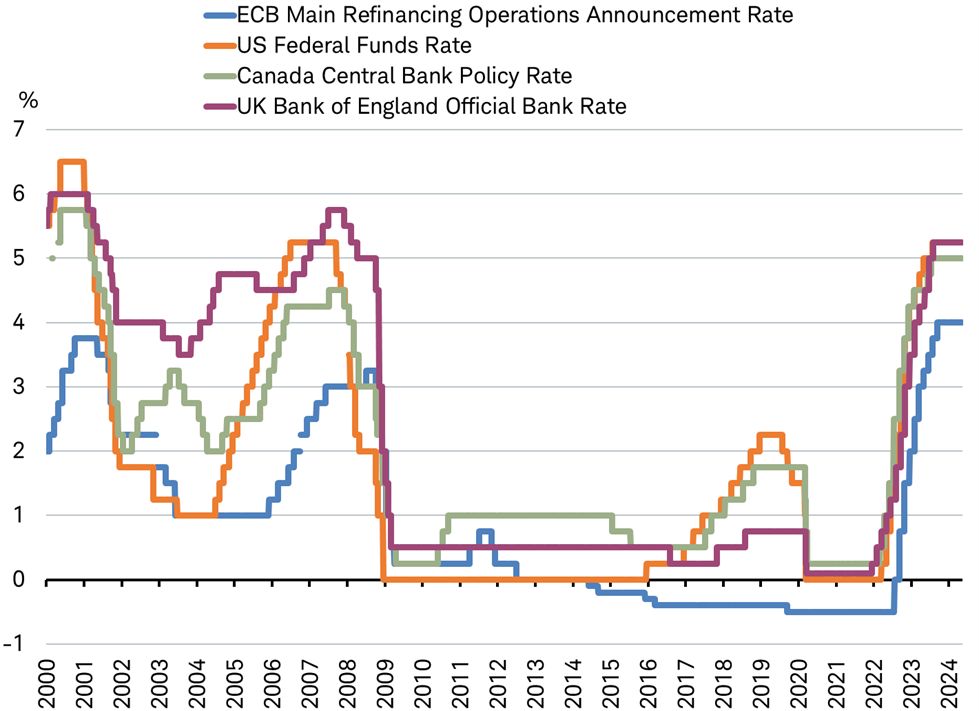
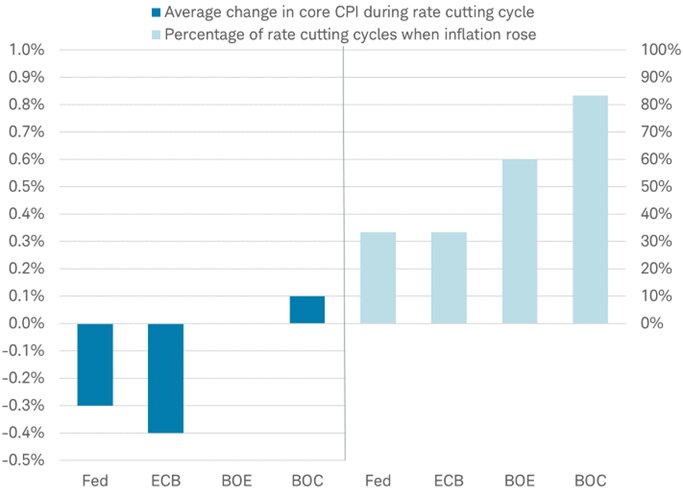
The average change in core CPI during a rate-cutting cycle by the BOE is zero.
- Second, OPEC members now have ample spare production capacity. When production is tight, exporting countries have little room to respond to increases in demand or shocks that can curtail output and cause prices to spike. The EIA estimates that OPEC's core members have around 4.5 million barrels per day of spare capacity, a sizable cushion roughly equivalent to the total output of the fifth largest oil producer in the world.
- Third, while oil demand is expected to continue to rise along with economic growth, the pace of demand growth is predicted to be much slower than in recent years, according to EIA forecasts. That implies the balance between oil supply and demand might remain tilted toward oversupply for the coming years. Notably, China, the world's second largest oil consumer, is likely to see soft demand in the near term as its economy struggles to find momentum.
Despite current geopolitical risks, these additional factors suggest that the price of oil seems unlikely to sustainably appreciate further, derail disinflation, or curb economic growth.
1 S&P Dow Jones Indices, as of 4/10/2024.
Kevin Gordon, Director, Senior Investment Strategist, contributed to this report.