How to Trade Futures on thinkorswim® for Beginners

If you're an active trader looking to explore new markets, futures can offer a wealth of new trading opportunities. Futures can be used as a strategy aimed at managing risks or potentially profiting from price movements across a variety of assets practically around the clock. But the futures market can be fast-moving and risky, so futures aren't for everyone. Education, practice, and understanding your risk tolerance are essential before risking real money trading futures. This guide is designed to give you the basic information you need to start practicing futures trading. Read on to learn:
- What futures are and how they work.
- A basic speculative futures trading strategy using Micro E-Mini S&P 500 futures.
- How to practice trading futures using the paperMoney® feature on the thinkorswim® desktop trading platform.
What is a futures contract?
A futures contract is a standardized, exchange-traded agreement to buy or sell an asset at a predetermined price at a specified time in the future. It's what's called a derivative because the contract "derives" its value from an underlying asset. Futures contracts are available on commodities like fuels, metals, and financial assets like interest rates and stock market indexes. They are used by people in industry to lock in prices, and by traders to speculate on future price movements. For example purposes, in this guide we'll focus on trading futures on the S&P 500® stock index, which can allow traders speculate on price changes in the S&P 500 without having to buy or sell all the stocks in the index. Specifically, we'll look at the Micro E-mini S&P 500 Index futures, which is traded using the symbol /MES.

Futures market trading hours
One potential benefit of futures is that they can be traded close to around-the-clock. Different types of futures products have different trading hours, but at Schwab, clients can access the market through the thinkorswim platform and trade /MES futures from 6 p.m. ET Sunday to 5 p.m. Friday. Note that there's a daily one-hour halt between 5 p.m. and 6 p.m. ET.
Futures margin and leverage
Futures also offer traders leverage, which lets them use a relatively small amount of capital to trade a large position. Unlike stocks, the current price of a futures contract is not the amount of money required to trade that contract. Instead, when you buy or sell a futures contract, you set aside a certain amount of money called margin. Leverage on a futures contract comes from the fact that the initial margin requirement is usually a fraction of the notional value of the contract. Notional value is the cash equivalent value to owning the underlying asset, or the contract's total value. Because traders can use that smaller amount of money to enter a large position, small changes in the underlying can translate into large gains. However, the opposite is also true: Leverage can magnify losses quickly and with smaller price movements. Keep in mind that although the initial margin requirement is typically lower for futures than for stocks, futures don't offer some of the potential benefits of owning stocks like voting rights or dividends. Additionally, futures contracts expire after a set period.
Futures margin is the amount of money you must deposit and keep on hand with your broker when you open and continue to hold a futures position. Note that this is different than margin in stocks. With stocks, you borrow against your assets like a loan. With futures, the margin acts like a good faith deposit or a performance bond, which is set aside when the trade is placed.
There are two types of futures margin: initial margin and maintenance margin.
- The initial margin requirement is the amount a trader must put up to enter a futures position.
- Once the position is established, the trader is held to the maintenance margin requirement, which is typically about 10% less than the initial margin. Traders must keep this amount on hand to stay in the trade.
Both initial and maintenance margin levels are set by the exchanges; however, Charles Schwab Futures and Forex LLC reserves the right to increase margins at any time without notice, which could happen on volatile products.
If your account value falls below the maintenance margin requirement, you'll be issued a margin call. If that happens, you must bring the account balance back up to the initial margin requirement by depositing money into your account, liquidating other positions to meet the amount needed, or closing the position. If you fail to do so, your position may be liquidated at a loss and you will be liable for any resulting debits.
Ticks, multipliers, and the price of a futures contract
As with any asset, the price of a futures contract moves with supply and demand. That's a given. The size and impact of those movements are determined by two additional elements, the tick size and the multiplier.
The tick size is the minimum price increment a particular contract can fluctuate. A stock's tick size is equal to a penny, meaning the minimum price movement is up or down one penny (+/– $0.01). Some futures contracts also have a penny tick, but many don't.
For example, the tick size for the Micro E-mini S&P 500 is 0.25 index points. The /MES can go from 5,780.25 to 5,780.50 to 5,780.75, and so on. Oil ticks in penny increments, while the Micro E-mini Dow futures tick in whole points.
Each contract also has a standardized multiplier. The multiplier is determined by the contract size and is set by the exchange. Just like tick sizes, multipliers can vary by product. For example, the /MES has a multiplier of $5.
The multiplier is used to calculate the financial, or notional, value of a contract. To calculate the notional value of one contract, multiply the current price by the contract multiplier. For example, if the /MES was trading at 5,780, the notional value of the contract would be $28,900 (5,780 x $5). Notional value can help you determine how much of your portfolio a contract could offset in a hedge.
How a futures trade works
To illustrate how futures margin, tick sizes, and multipliers lead to gains or losses in your account, let's walk through a hypothetical futures trade from beginning to end. A trader is bullish on the S&P 500 and "goes long," or buys, a Micro E-Mini futures contract. You can short, or sell, futures, but this example will focus on going long.
Suppose the /MES contract is trading at 5,600. This means it has a notional value of $28,000, which is the price times the multiplier of $5. In other words, if you wanted to buy a portfolio that reflected the S&P 500 with the same value as an /MES contract, you'd have to invest $28,000.
However, by using a futures contract, a trader can put down a fraction of the contract's $28,000 notional value. In this example, the initial margin requirement is $2,073, and the maintenance margin is $1,885. For simplicity's sake we'll say the trader's account balance is also $2,073. To enter the position, the trader may have to pay commissions and fees as well as have that $2,073 on hand.

Suppose that the day after the order is placed, the S&P 500 falls 20 points, so the contract that was worth 5,600 is now at 5,580. The 20-point drop times the multiplier of $5 means that the trader has lost $100 (20 x $5).
At the end of each trading day, futures trades are settled, a process called marked to market. This is where the daily gains or losses are credited to or subtracted from the account's cash. Traders who experience a loss will incur a cash debit to their account, and traders who experience a profit will receive a cash credit. Because this trader's position lost $100, their cash balance was debited by that amount.
The next day the S&P 500 continues to slide and loses another 20 points, or $100. Because the trader's position is down another $100, their account has fallen to $1,873, which is below the maintenance margin of $1,885. The trader will receive a margin call and has a choice: close out the trade or bring the account balance back up to the initial margin requirement of $2,073. This usually means depositing more money the day that the margin call is issued. Immediate action isn't always required, however, and some traders are fortunate enough to see their positions increase in value before the cash comes due.

That's what happens to this trader. The next day the S&P 500 rallies 45 points. That movement would mean that this trader's account increases by $225 and is now at $2,098. The account balance is back above the initial margin requirement, which means if immediate action was not required, it could settle there at the end of the day, and the margin call would be satisfied. Remember, if their position hadn't appreciated in value, the trader would have been required to add funds or close their position.
In the three days that this trade was in place, the trader's account went from $2,073 and ended with $2,098 for a return of 1.2%.
Trading futures on the thinkorswim desktop trading platform
Now that you're familiar with the fundamentals of futures, you're ready to learn the basics of trading futures on the thinkorswim desktop trading platform, which is designed for active traders. To do this, we'll walk through a very basic futures trading strategy and how to practice trading it using the paperMoney feature, which allows you to practice trading in simulated market conditions before committing real money. We'll use the paperMoney feature on the thinkorswim desktop version, so the interface may vary on the mobile or web experience.

The hypothetical trade we'll demonstrate is a bullish intraday trade on Micro E-mini S&P 500 futures using technical analysis to determine entry and exits. This means the goal is to buy a contract to enter the trade, have the contract increase in value as the index rises, and then sell to exit the trade for a profit in a matter of minutes to hours.
When trading futures, you should also be aware of transaction costs. You can view the commission structure on the pricing page on Schwab.com. There are also exchange and regulatory fees, which vary by exchange and product. Regulatory fees are assessed by the National Futures Association (NFA) and can change at any time without notice.
Like any other trade, a futures trade is a series of decisions about what to trade, how much to trade, when to enter, and when to exit. We'll walk through each decision and how to complete it on the thinkorswim platform.
Selecting futures products and understanding the ticker symbol
To start trading futures, open the thinkorswim platform. Click the Trade tab, then click the Active Trader subtab. This is a customizable layout with tools specifically for trading fast-moving products like futures.
The first decision is what to trade. For this example, enter the ticker symbol /MES to see all the current activity in Micro E-Mini S&P 500 contracts. There are other types of S&P 500 futures, but /MES contracts are typically very liquid, which can make it easier for orders to fill, and have the smallest capital requirements.

Here's a breakdown of symbol /MESZ24:
- The forward slash, /, is used by the thinkorswim trading platform to identify a futures contract.
- The prefix, M, shows that the contract is the micro version.
- The root symbol, ES, is the symbol for the S&P 500 E-mini futures contract.
- The month of expiration symbol, Z, means that this symbol expires in November.
- Finally, the last two digits show the year of expiration which, in this case, is 2024.
The thinkorswim platform defaults to the "active" contract, which is usually the contract with the highest volume and open interest. However, when expiration is approaching, it may be wise to consider other contracts. This is because the liquidity in the current contract generally dries up and goes to the next contract. Low liquidity can result in less favorable order pricing.
How to set up thinkorswim desktop for trading futures
The Active Trader subtab contains tools designed especially for traders, like one-click order entry, an easy-to-use bid/ask price ladder, fully customizable charting, and advanced order types. To customize the layout for the basic strategy we're looking at today, select the grid button and choose one cell. Then, select the Chart (C) and Active Trader (AT) buttons on the right, and make sure the other buttons are unselected. On the left, you'll see the chart, and on the right, you'll see the active trader ladder.
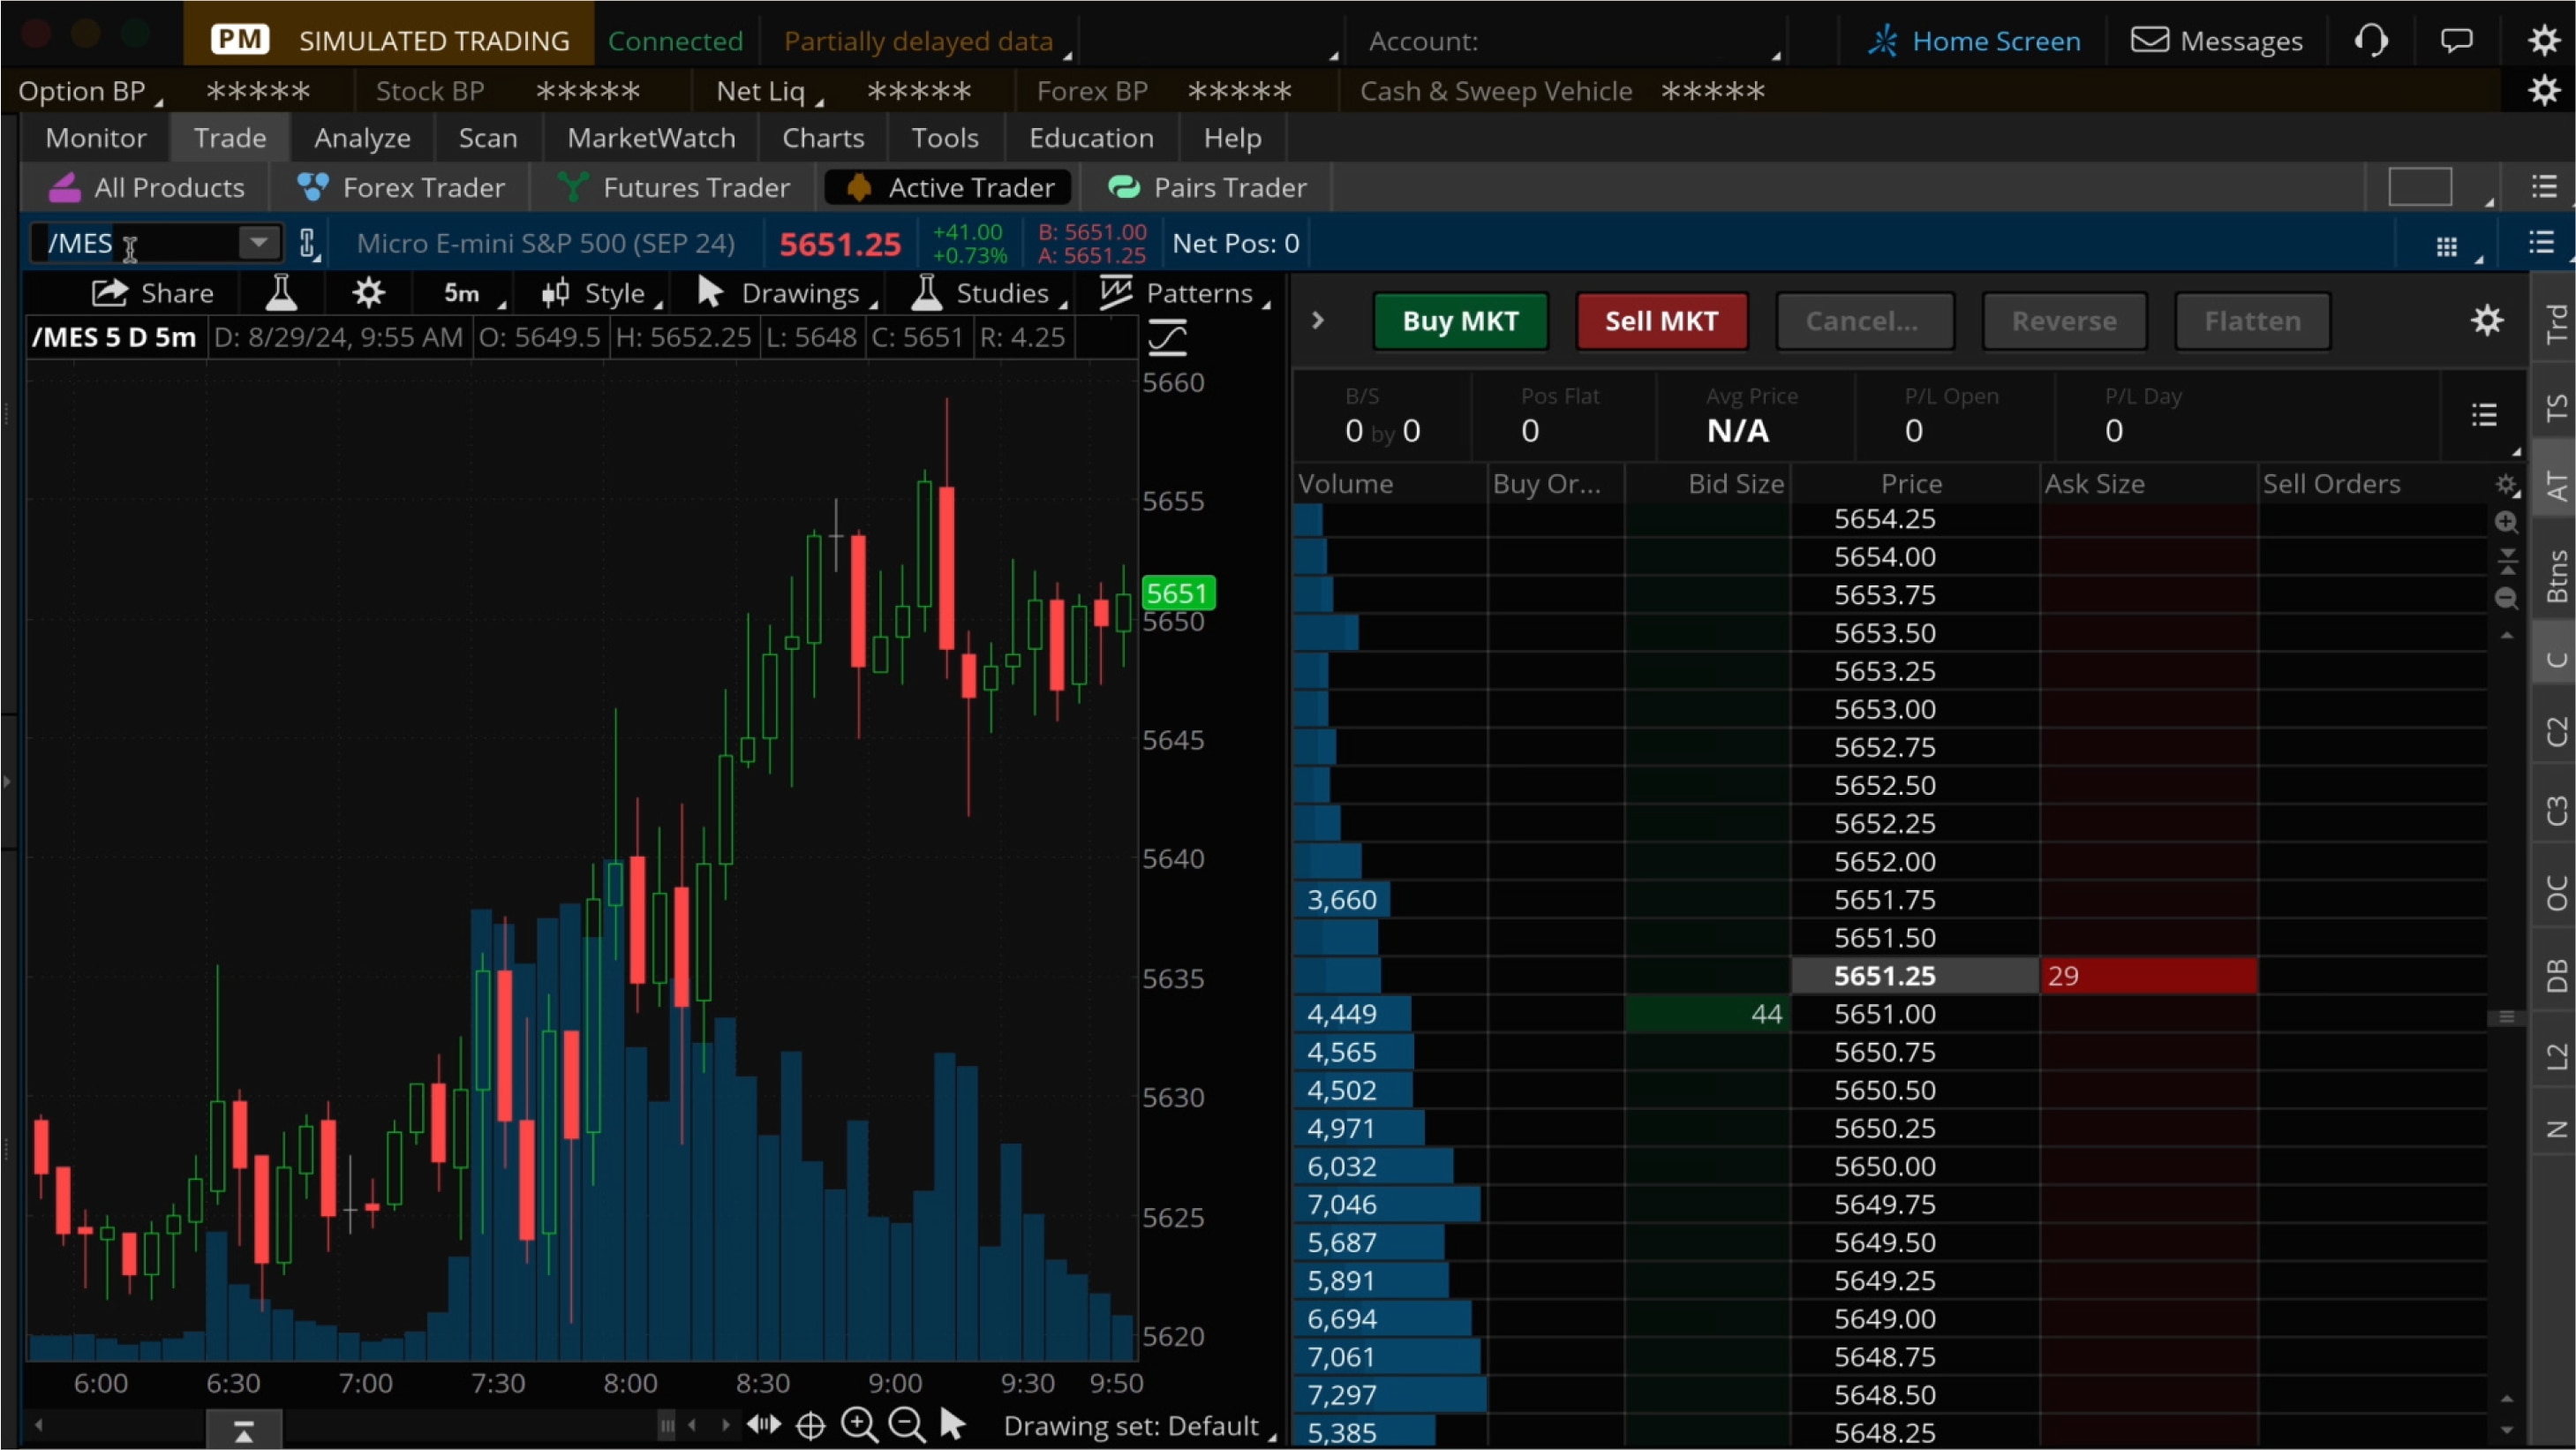
The first column of the ladder shows the total Volume in the contract. Next are the number of Buy Orders, the Bid Size, the Price, the Ask Size, and the number of Sell Orders. The number of buy or sell orders will give you an indication of the amount of demand in the market. Are there more buyers than sellers? That will drive the price up. The price will go down if there are more sellers than buyers. Look at the price quote, too. The bid side shows the price that the broker pays to sellers. The ask price is the price that the broker charges buyers. The wider that spread, the more unbalanced the supply and demand. If the spread is wide and the demand is unbalanced, look at a different contract that has a more even number of buy and sell orders.
At the top of the ladder are tools for placing orders, which we'll look at later.
The thinkorswim platform has other tools and features tailor-made for active futures traders. The thinkorswim YouTube playlist has detailed demos of each of them.
Finding entry and exit points using support and resistance
Once you've chosen a product to trade and have the platform set up, you're ready for the next decision: Identify entry and exit points for your trade. You can do this using the chart.
One place to start is looking for areas of support and resistance. You can think of support and resistance like rough floors or ceilings the price has tended to bounce off. This is a common tool, used by traders who practice technical analysis, for identifying entry and exit signals for trades across all kinds of assets. These technical traders might look for sections that have three to five touchpoints for support and another three to five for a resistance line.

For bullish entry signals, traders often look for a bounce, where the price touches then bounces off the support level, or a breakout, where the price breaks through what had been a resistance level. They then project a target exit based on the distance between the previous level of support and resistance. This is an extremely basic strategy for identifying entries and exits, so it makes a good demonstration. You can learn more sophisticated strategies over time.
Identifying support and resistance can be subjective and depend on the timeframe you're looking at. Looking at the previous day or night's price levels can give you a starting point, or you can focus on a shorter timeframe within the day you're trading. The first 30 minutes after the stock market opens tends to be particularly volatile, so a cautious trader may want to consider waiting to trade a little later in the day when markets may be more calm.

In this example, you can see that after falling, /MES seemed to be forming a new potential support line around 5,605 and resistance around 5,616. You can use the drawing tools in thinkorswim to make these lines more visible. Once you have identified support and resistance, you can begin looking for entries and potential exits.
When trading futures, many traders identify two potential exits: one for if the trade goes your way, called a price target, and one for if the trade moves against you, called a stop level. Having a predetermined target can help you counteract greed and potentially take profits before your gains evaporate. It may be frustrating to miss out on gains if the index keeps rising after you exit, but having a plan and being consistent can help manage risk over time.
Likewise, having a predetermined stop level is designed to help you set an order that attempts to close out of your position if losses begin to pile up.
The price target and a stop level are often based on the distance between the support and the resistance.
Based on the support and resistance lines here between 5,605 and 5,616, a possible bullish entry point could be a bounce off 5,605 or break above the 5,616 line. If the breakout turned out to be the case, a potential stop might be 5,605. To the upside, because the difference between the support and resistance lines is roughly 10 points, you might set a price target at about 5,626.
Bracket orders
Because the futures market moves quickly, manually entering single orders to enter and exit can be challenging. There's a solution: the bracket order. A bracket order allows you to set one limit order at your target, and a stop order at your stop level. Limit and stop orders remain working until the product you are trading hits the price specified in one of the orders or they are manually canceled or expire. When the price of either order is hit, that order could trigger a fill and then seeks to cancel the order that did not trigger. The bracket's objective is to simultaneously help protect against a trade going poorly, while positioning us for hopefully locking in upside gains.

For a long trade, the target price will be above the entry point and the stop loss will be below it. The situation is reversed for short contracts: The target price is below the entry point and the stop loss is above it.
Remember, though, there's never any guarantee your order will fill at the price you intend or at all.
To enter a bracket order on thinkorswim, click the caret at the top of the active trader ladder. Go to Template, then select TRG w/ bracket. Under Offset Order, enter the distance of the trade, which is the difference in numbers of ticks between your entry and your stop prices. This will automatically calculate the limit, which is your price target, and your stop, to be that amount above and below whatever price you make your entry.

Based on the current price, the entry point on this long trade could be 5,606—basically, you'd be waiting for the price to fall back to about 5,606 and riding a potential bounce back up. In this case, the trader could set a stop of 5,596 and a price target of 5,616. This means that if you exit at 5,596, the loss per contract is 5,606 minus 5,956, which is 10. Multiply 10 by the $5 multiplier for a dollar loss per contract of $50. However, stop orders are not guaranteed an execution price (or an execution at all), so keep that in mind.
To manage risk effectively, traders should set a per-trade risk limit. Suppose a trader has a $50,00 account and does not want to lose more than 1% of it on any given trade, for a per-trade risk of $500. The loss per contract, calculated above, is $50. Divide that number into the maximum risk per trade to find out how many contracts you can trade. In this case, divide the maximum dollar loss per trade of $500 by the theoretical dollar loss per contract on this particular trade of $50, for one contract traded.
To simplify: The number of contracts to trade is equal to the trader's loss limit per trade divided by the theoretical maximum loss per contract on a particular trade.
Now that we've determined our entry and exits and how many contracts to buy, all that's left is to wait for the entry signal to be reached—in this case, the /MES bouncing off support at 5,606. You can wait for the bounce off support and enter the trade manually by clicking Buy MKT at the top of the active trader ladder, or put in your buy order ahead of time as a limit order just above support at something like 5,606.50, which will trigger automatically if the price reaches that level. To enter that limit order, you'd click in the Bid Size column next to 5,606.50. Either way, when you enter the order, you'll see the order confirmation box.

Transaction costs
The Order Confirmation Dialog box in thinkorswim shows the parts of the bracket order, the commissions due on whichever orders fill, and the buying power effect, which is another way of describing the initial margin requirement for entering the trade.
To enter the trade, click Send. The confirmation box will disappear. You'll be notified when or if the initial order fills, and if the order fills it will appear under Filled Orders on the Monitor tab.
How a futures trade might end
When it's time to take your profits—or cut your losses—you'll close out your trade.
To close a futures position, you'll need to do the opposite of what you did to open it. If you're long the contract, you'll need to close the position by selling it. If you're short the contract, you'll close the position by buying back. The same transaction costs for opening the trade apply to closing it. If it works as intended, a bracket order will trigger a closing order for you automatically once your price target or stop loss is hit. This takes your emotion out of the trade.
A trade like our example typically ends with one of three outcomes (assuming you're using a bracket order):
- Positive: The futures contract hits your limit, which is your target price. The platform automatically sends an order at this level, and if it's filled, the position is closed out, and you have a profit.
- Negative: The futures contract hits your stop, the platform automatically sends an order at this level, and if it's filled, the position is closed out, and you have a loss.
- Neutral: At the end of the day, your trade may be stuck between your targets. Many new futures traders avoid holding on to positions overnight to reduce the risk from price changes due to news events when they are unable to close the position. The futures market will be open, but will you be awake? Closing the position at the end of the day reduces this risk, as well as the size of the gain or loss.
Keep in mind that there's no guarantee any order will fill, especially during periods of extreme market volatility, so gains or losses could potentially exceed the levels of your bracket order if it does not fill.
In this example, if you were able to enter the trade at 5,606.50 and the price rose to 5,616, it would have triggered the order at our limit and resulted in a possible profit of about $50 per contract (10 x $5). If the price fell and your stop loss order is executed at 5,596, you would end up with a possible loss of about $50 per contract (10 x $5). And, if the price was between 5,616 and 5,596 when you decided to close up shop for the day, your profit (or loss) would be between +$50 and –$50.
Bottom line
While there are substantial risks of loss in the futures market, it can provide great opportunities for potential profits. The market works differently from the stock market, so it requires some upfront education. If you're interested in finding out more about how futures work after reading this article, go to the paperMoney feature on the thinkorswim platform and experiment. This will help you learn the tools, identify potential trades, and practice entering orders. You can learn more about futures on Schwab's Insights & Education page and by taking the Fundamentals of Futures training course.